

I still remember the first time our team pushed a broken build to production on a Friday afternoon. Not a fun memory. It was a small config error — the kind that looks harmless in isolation — but it cascaded into a three-hour incident that had everyone scrambling over the weekend. After that, our lead engineer basically made it a personal mission to find tools that catch issues before they escape into the wild.
That experience is exactly why I care about audit tools. Not because some best-practice doc told me to, but because I’ve felt the difference between “we caught it in staging” and “the client is calling us right now.”
If your team is still relying on manual code reviews or end-of-sprint checks, this list is for you. These nine tools have genuinely helped teams (including mine, at various jobs) surface errors earlier in the development lifecycle — and a few of them surprised me with how much they caught that I thought we already had covered.
1. SonarQube — The One That Changed How We Think About Code Quality
SonarQube was the first static analysis tool I used at scale, and honestly, it felt like someone turned on the lights in a messy room.
It continuously inspects your codebase for bugs, code smells, security vulnerabilities, and duplications. The dashboard gives you a “quality gate” — basically a pass/fail score — which makes it easy to block merges that don’t meet your standards.
What caught me off guard: the number of low-severity issues that, when you look at them together, paint a picture of technical debt you didn’t know you’d accumulated.
Best for: Java, JavaScript, Python, C# codebases. Supports 30+ languages.
Practical tip: Set up quality gates inside your CI/CD pipeline so developers see feedback before code even gets reviewed by a human.
| Feature | SonarQube Community | SonarQube Developer |
|---|---|---|
| Languages Supported | 15+ | 30+ |
| Branch Analysis | ❌ | ✅ |
| Security Hotspots | Basic | Advanced |
| CI/CD Integration | ✅ | ✅ |
| Price | Free | Paid |
2. ESLint — The One That Lives in Your Editor
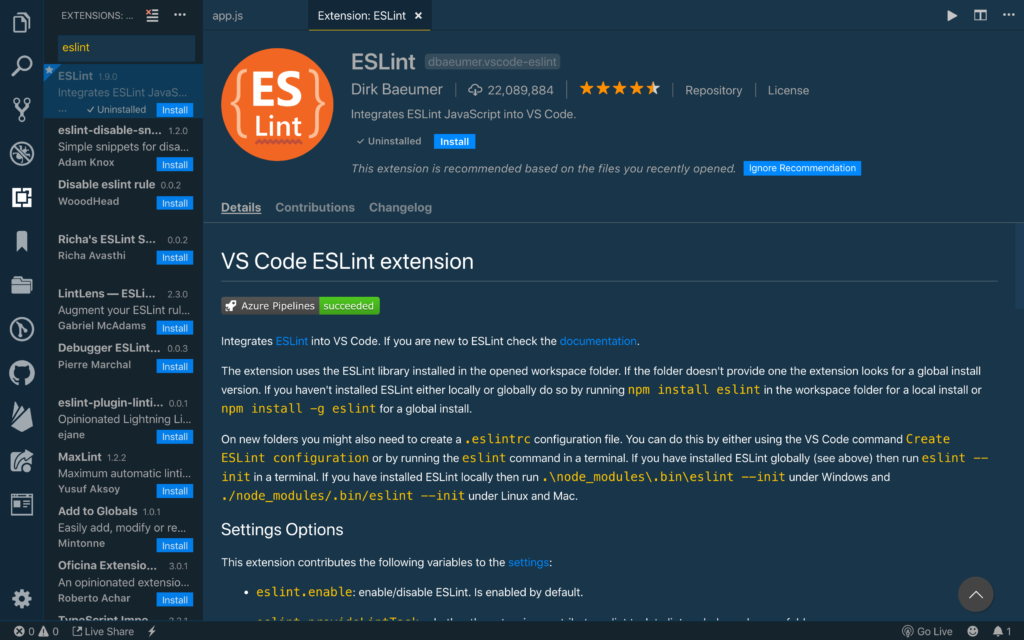
If SonarQube is the doctor doing your annual checkup, ESLint is the friend who taps you on the shoulder while you’re still typing.
It’s a JavaScript/TypeScript linter that flags syntax issues, code style violations, and logic errors in real time. Most developers have it running inside VS Code or WebStorm, so they get feedback with every keystroke.
I’ve seen junior devs avoid entire categories of bugs just because ESLint was yelling at them before they could commit. That’s genuinely valuable.
One mistake I see often: teams install ESLint but never configure it beyond the defaults. Spend an hour setting up a shared .eslintrc with your team’s specific rules. It’ll save far more time downstream.
The plugin ecosystem is huge too — there are ESLint plugins for React, accessibility, security patterns, and more. It’s not just a style cop; it can be a real error-catching tool if you use it right.
3. Checkmarx — When Security Audits Actually Need to Be Serious
For teams building financial apps, healthcare platforms, or anything that handles sensitive data, Checkmarx is in a different category. It’s a Static Application Security Testing (SAST) tool that scans your source code for security vulnerabilities before deployment.
What separates it from a general linter is depth. It understands data flow — so it can trace how user input travels through your application and flag places where it might reach a vulnerable sink without proper sanitization.
I once watched a Checkmarx scan catch a SQL injection vector that had been sitting in legacy code for two years. Nobody had noticed it because it was buried five function calls deep. No manual review would have caught that reliably at scale.
If you’re working in a regulated industry, tools like Checkmarx become less of an option and more of a compliance requirement. And speaking of compliance, teams doing security audits for neobanks and digital wallets will find SAST tools like this absolutely essential in their audit workflow.
4. Selenium + Automated Test Suites — Error Detection Through Behavior
A lot of people think of Selenium purely as a testing framework. But used correctly, it’s an audit tool — one that validates whether your application behaves the way it’s supposed to after every change.
When we hooked our Selenium suite into our deployment pipeline, we started catching regression bugs that static analysis tools completely missed. These were behavioral errors — things like a button that stopped working after a refactor, or a form that accepted invalid data after a validation rule got accidentally removed.
The setup takes effort. Writing good Selenium tests is a skill, and flaky tests can become their own kind of noise. But once you have stable, meaningful test coverage, the confidence you get before a release changes completely.
Lesson learned the hard way: Don’t let your test suite become a checkbox exercise. Tests that always pass because they’re testing trivial things are worse than having fewer, tougher tests.
5. Datadog — Catching Errors in Production Before Users Do
Here’s the honest truth: no amount of pre-deployment checking catches everything. That’s where Datadog comes in.
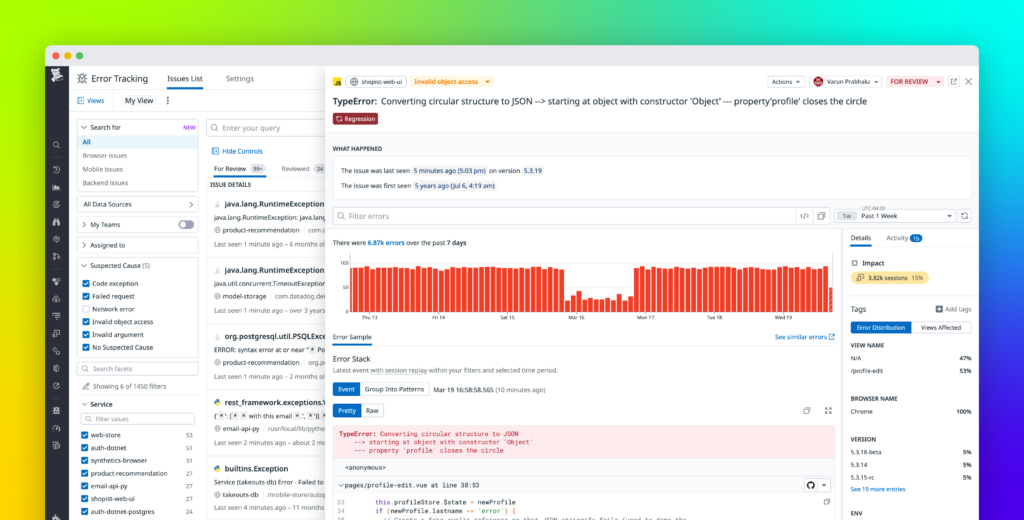
Datadog is an observability platform — it monitors your application in real time, aggregates logs, tracks performance metrics, and alerts you when something goes wrong. But the audit angle comes from its anomaly detection features, which can flag unusual patterns (sudden spike in errors, unexpected latency increases) before they escalate into actual incidents.
What I find most useful is the correlation between deploys and error rates. Datadog can show you, visually, that error rates spiked exactly when you pushed that new release at 3 PM. That kind of audit trail is invaluable for post-mortems and for convincing stakeholders that a rollback is necessary.
It’s not cheap, but for production systems that genuinely can’t afford downtime, it pays for itself.
6. GitHub Actions with Code Scanning — Built Into Where You Already Work
If your team is already on GitHub, you’re potentially sitting on an audit tool you’re not fully using.
GitHub’s built-in code scanning (powered by CodeQL) can automatically analyze your code for vulnerabilities on every push or pull request. It integrates directly into the PR workflow, so reviewers see security findings right alongside regular code comments.
The best part? It’s free for public repositories and reasonably priced for private ones. I’ve recommended this to small startup teams who couldn’t justify the cost of enterprise SAST tools, and CodeQL has caught real issues for them.
Here’s a basic workflow snippet that gets you started:
yaml
name: Code Scanning
on: [push, pull_request]
jobs:
  analyze:
    runs-on: ubuntu-latest
    steps:
      - uses: actions/checkout@v3
      - uses: github/codeql-action/init@v2
        with:
          languages: javascript
      - uses: github/codeql-action/analyze@v2
That’s genuinely all you need to get baseline scanning running. You can tune it further from there.
7. Snyk — Because Your Dependencies Are Also Your Problem
Here’s something that used to fly under the radar in a lot of teams: your own code might be clean, but the 200 npm packages you imported? Not necessarily.
Snyk scans your dependency tree for known vulnerabilities and, crucially, tells you exactly what to upgrade and how to fix it. It integrates with GitHub, GitLab, Bitbucket, and most CI tools.
The part that surprised me when I first used it was just how many “low severity” vulnerabilities existed in commonly-used packages. Most were genuinely low risk, but a handful were things we needed to patch urgently — and we wouldn’t have known without Snyk.
For teams doing thorough digital wallet security audits, dependency scanning is one of those steps that often gets skipped but absolutely shouldn’t be.
Common mistake: Running Snyk once, fixing what it finds, and never running it again. Vulnerabilities get discovered in packages over time, so this needs to be a continuous process, not a one-time scan.
8. Kibana + ELK Stack — Turning Logs Into Auditable Intelligence
Raw logs are a graveyard of useful information that nobody looks at until something breaks. The ELK Stack (Elasticsearch, Logstash, Kibana) changes that by turning logs into searchable, visual dashboards you can actually monitor.
Kibana in particular is what makes it useful for error detection. You can build dashboards that surface error rates, track specific exception types over time, and set up alerts for patterns that suggest something is wrong.
In one role, we set up a Kibana dashboard that tracked a specific class of validation errors from user inputs. By watching that dashboard over a sprint, we realized one of our form fields was consistently generating errors for a subset of users — an issue that wasn’t urgent enough to trigger an alert, but was definitely telling us something was wrong with our validation logic.
That’s the power of this kind of tool: it surfaces patterns that individual alerts miss.
| Tool | Best For | Learning Curve | Cost |
|---|---|---|---|
| Kibana | Log visualization & exploration | Medium | Free (self-hosted) |
| Datadog | Production monitoring & alerting | Low | Paid |
| Grafana | Metrics dashboards | Medium | Free/Paid |
| Splunk | Enterprise log management | High | Expensive |
9. Jira + Audit Log Features — Yes, Really
This one might feel out of place next to security scanners and code analyzers, but hear me out.
For teams, especially larger ones, a huge category of “errors” isn’t code errors — it’s process errors. Wrong tickets getting closed, requirements changing without documentation, deployments happening without proper approval. Jira’s audit log (and similar features in Linear, Asana, or Monday) captures a timestamped record of every action taken within a project.
I’ve used Jira audit logs during post-mortems to reconstruct exactly what happened and when. It’s tedious work, but having that paper trail has saved teams from misplaced blame and helped identify genuine process gaps.
For teams working on security-sensitive products, having an auditable process log is also increasingly a compliance requirement. If someone asks “who approved that change and when,” you need to be able to answer.
Common Mistakes Teams Make With Audit Tools
A few patterns I’ve seen again and again that undercut the value of these tools:
Treating them as one-time checks. Security, code quality, and log monitoring are ongoing processes. Scanning once at the start of a project and never again is almost worse than not scanning at all — it gives you false confidence.
Alert fatigue from misconfigured thresholds. If your monitoring tool pages your team 50 times a day, everyone will start ignoring it. Tune your alerts carefully. A few meaningful signals are worth more than a flood of noise.
No ownership of findings. Audit tools are only useful if someone is accountable for acting on what they find. Assign ownership. Build triage into your sprint workflow.
Using tools in isolation. The best audit setups layer tools — static analysis plus dependency scanning plus runtime monitoring. Each catches a different class of issue.
Building Your Audit Stack
You don’t need all nine of these at once. Here’s how I’d think about building up your stack based on team size and maturity:
Small team / early stage:
- ESLint (immediate, low cost)
- Snyk (dependency scanning, free tier is solid)
- GitHub Actions + CodeQL (built into your existing workflow)
Growing team:
- Add SonarQube for broader code quality visibility
- Add Datadog or a simpler alternative like New Relic for production monitoring
Mature / regulated product:
- Layer in Checkmarx or a comparable SAST tool
- Implement ELK Stack for log aggregation
- Consider Selenium-based regression suites if not already in place
The goal isn’t to have the most tools — it’s to have no blind spots. Early error detection isn’t about catching everything before it happens (that’s impossible), but about shrinking the window between when an error is introduced and when your team knows about it.
Every hour you shave off that window is an hour you’re not spending on emergency fixes, angry client calls, or weekend war rooms.
And if you’re specifically looking at security audits for financial or fintech products, this piece on proven neobank digital wallet security audits for total protection is worth a read alongside your tooling decisions.
Final Thoughts
The shift from reactive to proactive error detection is one of those changes that feels slow while it’s happening and then suddenly obvious once it’s in place. You stop dreading deploys. Post-mortems get shorter. Developers feel safer making changes.
None of these tools are magic. They all require setup, tuning, and someone caring enough to act on what they surface. But that investment pays off faster than most teams expect.
Start with one tool, get it working properly, and then layer from there. That’s always worked better than trying to implement five things at once and doing none of them well.